Extension for Polymarket· Chrome, Firefox & Edge
See who holds every market, and how they trade.
Poly Fast adds trader analytics to Polymarket: the top holders of every outcome with their P&L, and any trader’s win rate, ROI and standing in each category.
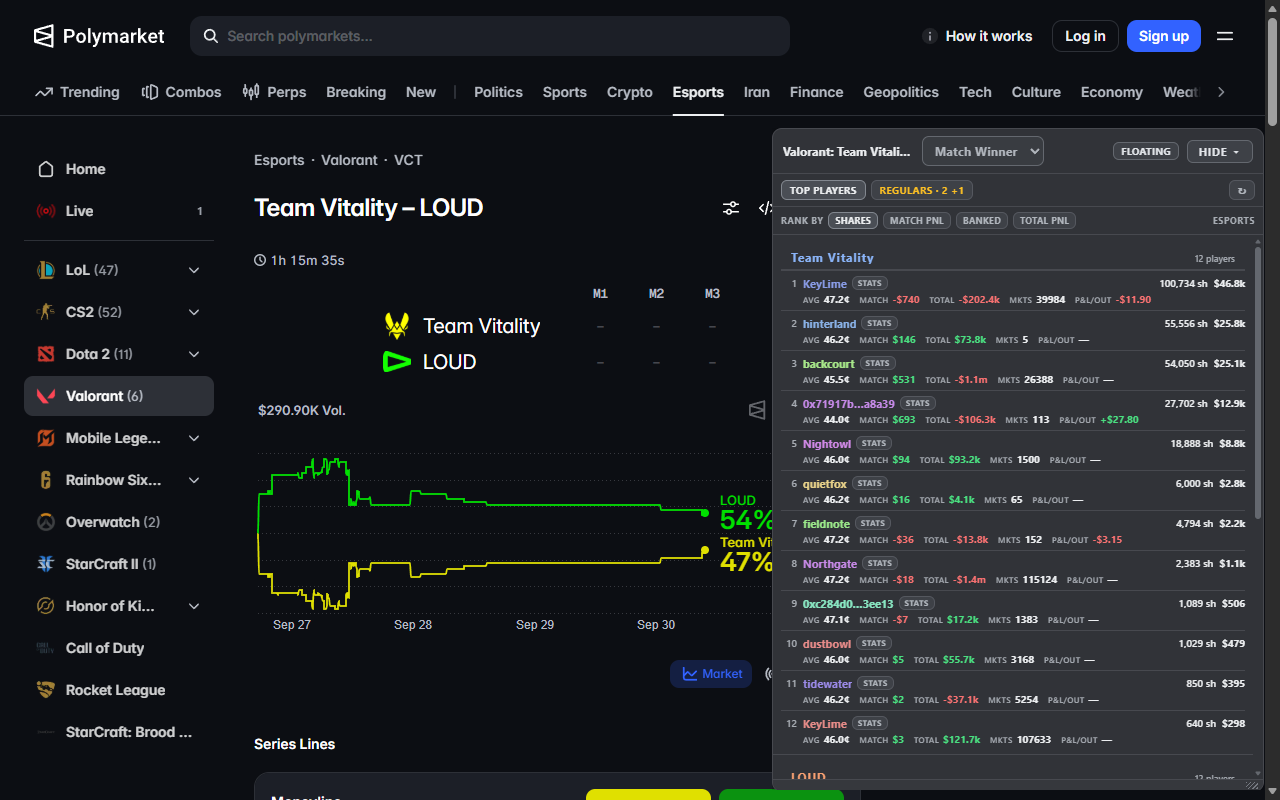
Everyone in the market, and their record
Who holds the match
The top holders of each outcome of the market you open: their shares, their average price, and what the position is worth now.
How they are doing on it
Profit or loss on this market, open and realised, beside each holder’s all-time P&L in the category and how many markets they have traded.
Ranked four ways
By shares, by P&L on this match, by realised P&L, or by all-time P&L. Each ranking is asked of Polymarket itself, so you see the right list, not a re-sort of another one.
A win rate worth reading
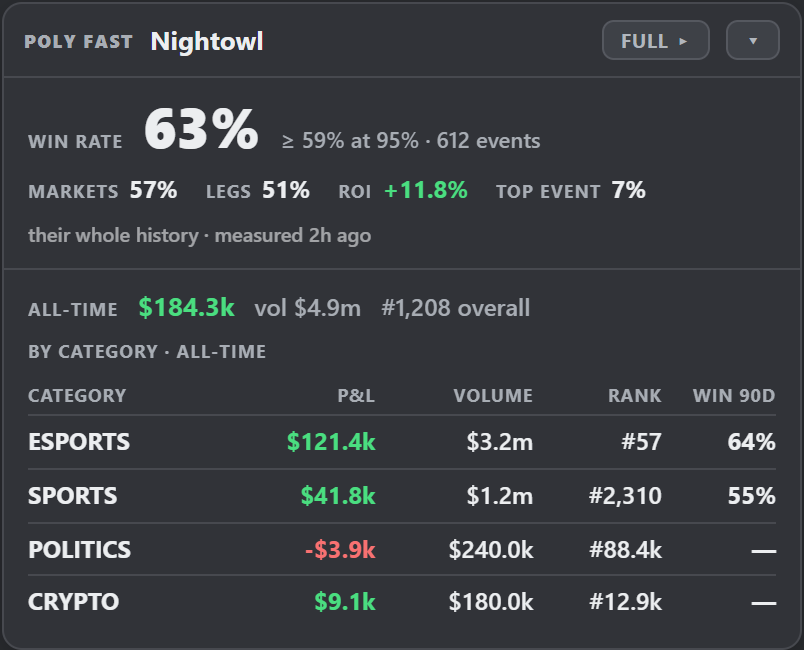
Counted by event, by market and by single outcome, each with a 95% lower bound, so twenty lucky events do not pass for skill.
Every category
All-time P&L, volume and rank on each of Polymarket’s category leaderboards, for any wallet: sports, esports, politics, crypto and the rest.
Where you want it
Pinned in Polymarket's own column or floating anywhere on the page. Resizable; light, dark, or following the page.
A record on every profile
Open anyone’s Polymarket profile and a card shows their win rate, their ROI and how much of their profit came from a single event, with where they stand in every category. A trader nobody has measured yet is measured as you open them, usually within a minute.
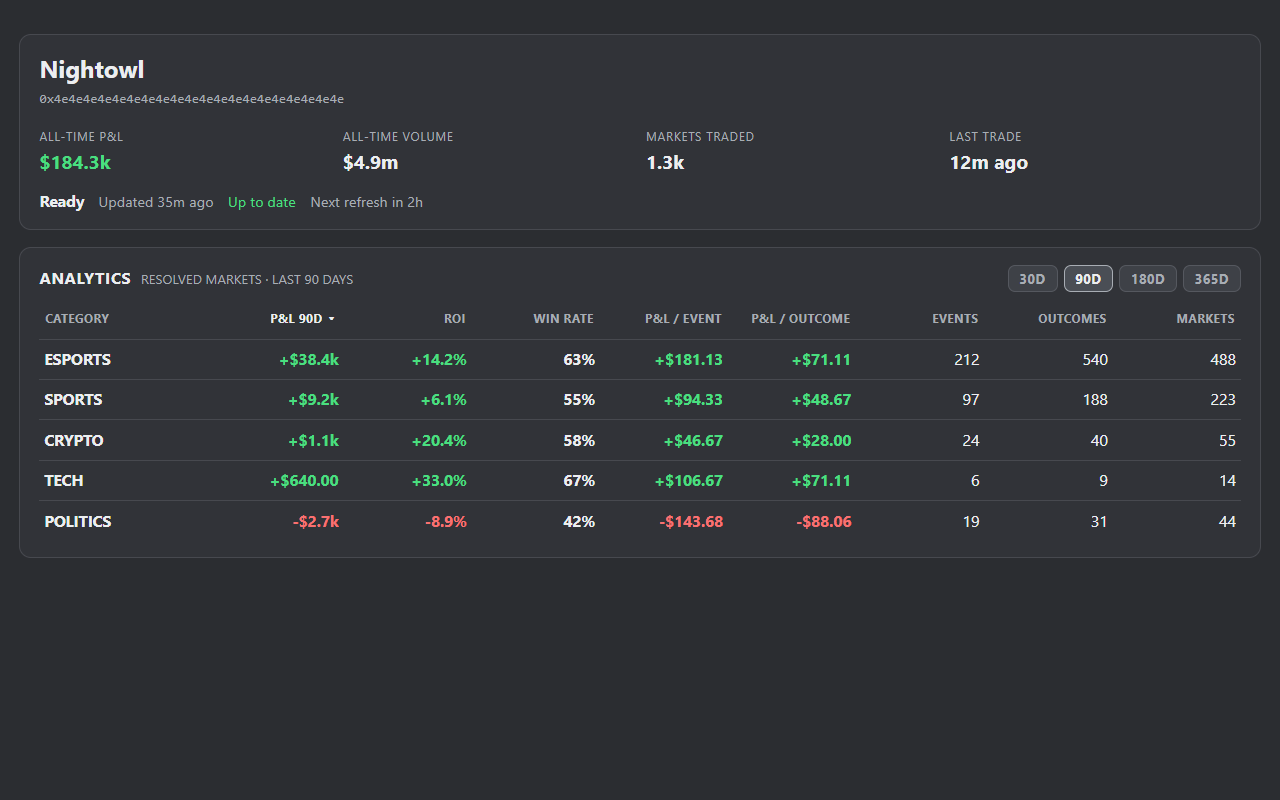
Their whole record, category by category
The trader page breaks their resolved markets down by category over 30, 90, 180 or 365 days: P&L, ROI, win rate, and what one event and one outcome were worth to them. Sort by any column.
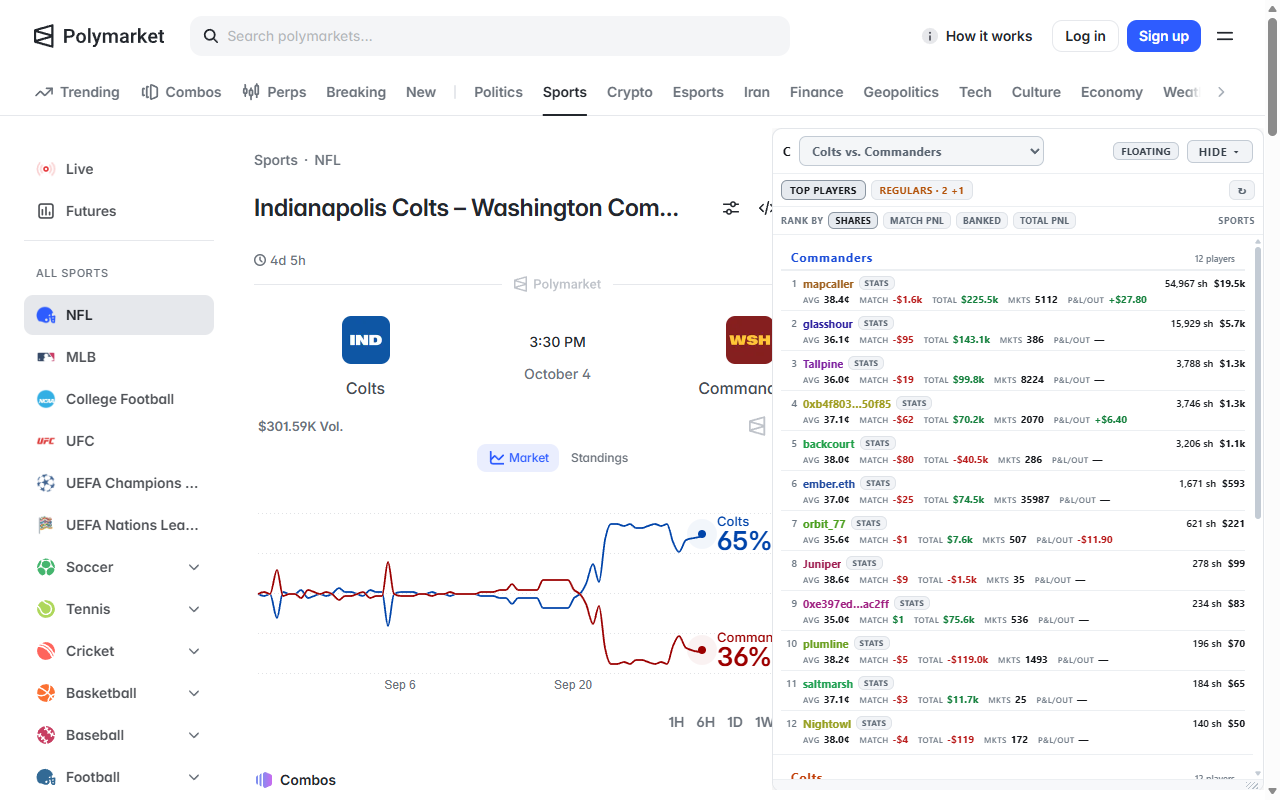
Every market of the event
An esports event can carry sixty markets. Pick any of them from the panel’s list, which keeps the match and map winners in the order they are played and drops the props. Light, dark, or following the page.
Counted the honest way
Losses count
A position held to zero never closes, so a record built from exits alone shows almost nothing but winners. Ours counts both.
Small samples say so
Every win rate carries its 95% lower bound. 60% over 20 events and 60% over 400 are different claims, and the floor tells them apart.
Three units, not one
By event, by market and by outcome. A trader who covers every map of a match wins events and loses legs, and the gap between the three shows it.
The analytics work without signing in and need no access to your wallet. What reaches our server, and why, is in the privacy policy.